
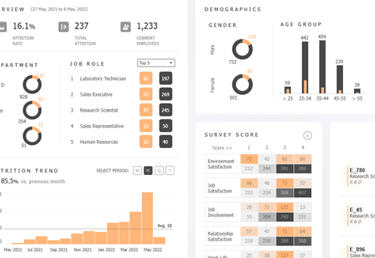
Insight-Driven Reporting & Dashboard Development
Get clear, intuitive reports and dynamic dashboards that transform complex, raw data into real-time answers for daily operational and tactical decision-making
The Delivery Difference
Distinguish your dashboards from generic, complex reporting tools that nobody uses.


Our Focus
We focus on building a minimum viable dashboard that answers 1-3 critical business questions per role. This ensures adoption and immediate action.
The Problem with Standard Reports
Most companies suffer from "dashboard fatigue", having too many screens that are too complex and don't lead to any action.
How We Develop Insights
User Persona Definition


We identify who needs the data and what specific actions they need to take, ensuring the design is tailored to their role.


Rapid Prototyping
Using agile methods, we quickly build and test low-fidelity prototypes with end-users to gather feedback, avoiding costly reworks later.
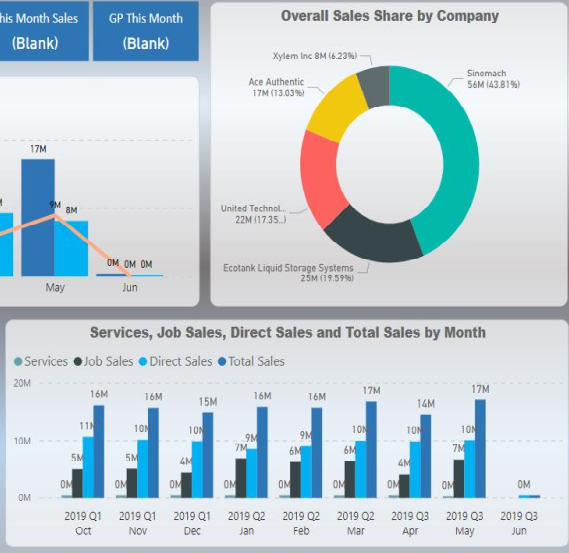
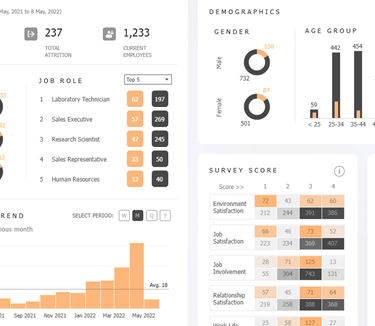
We apply data visualization techniques to ensure clarity, focusing on intuitive charts and clear, color-coded alerts to draw attention to critical issues.
Data Visualization Excellence
Expert Data Visualization
We apply best-in-class science and design principles to ensure clarity, focusing on intuitive charts, clear color-coding, and information hierarchy to drive immediate understanding.
Seamless Integration & Deployment
We deploy the final solution, integrating it with your existing platforms and ensuring fast load times for a single, unified view of performance.

